I gave a two-minute lightning talk at the CIVR-HRP (Center for Influenza) annual meeting in Spring 2022. CIVR-HRP is an NIH-funded CIVIC (Collaborative Influenza Vaccine Innovation Centers) site at the University of Georgia, Athens, GA, USA. There were no poster presentations, so I got to give an actual talk.
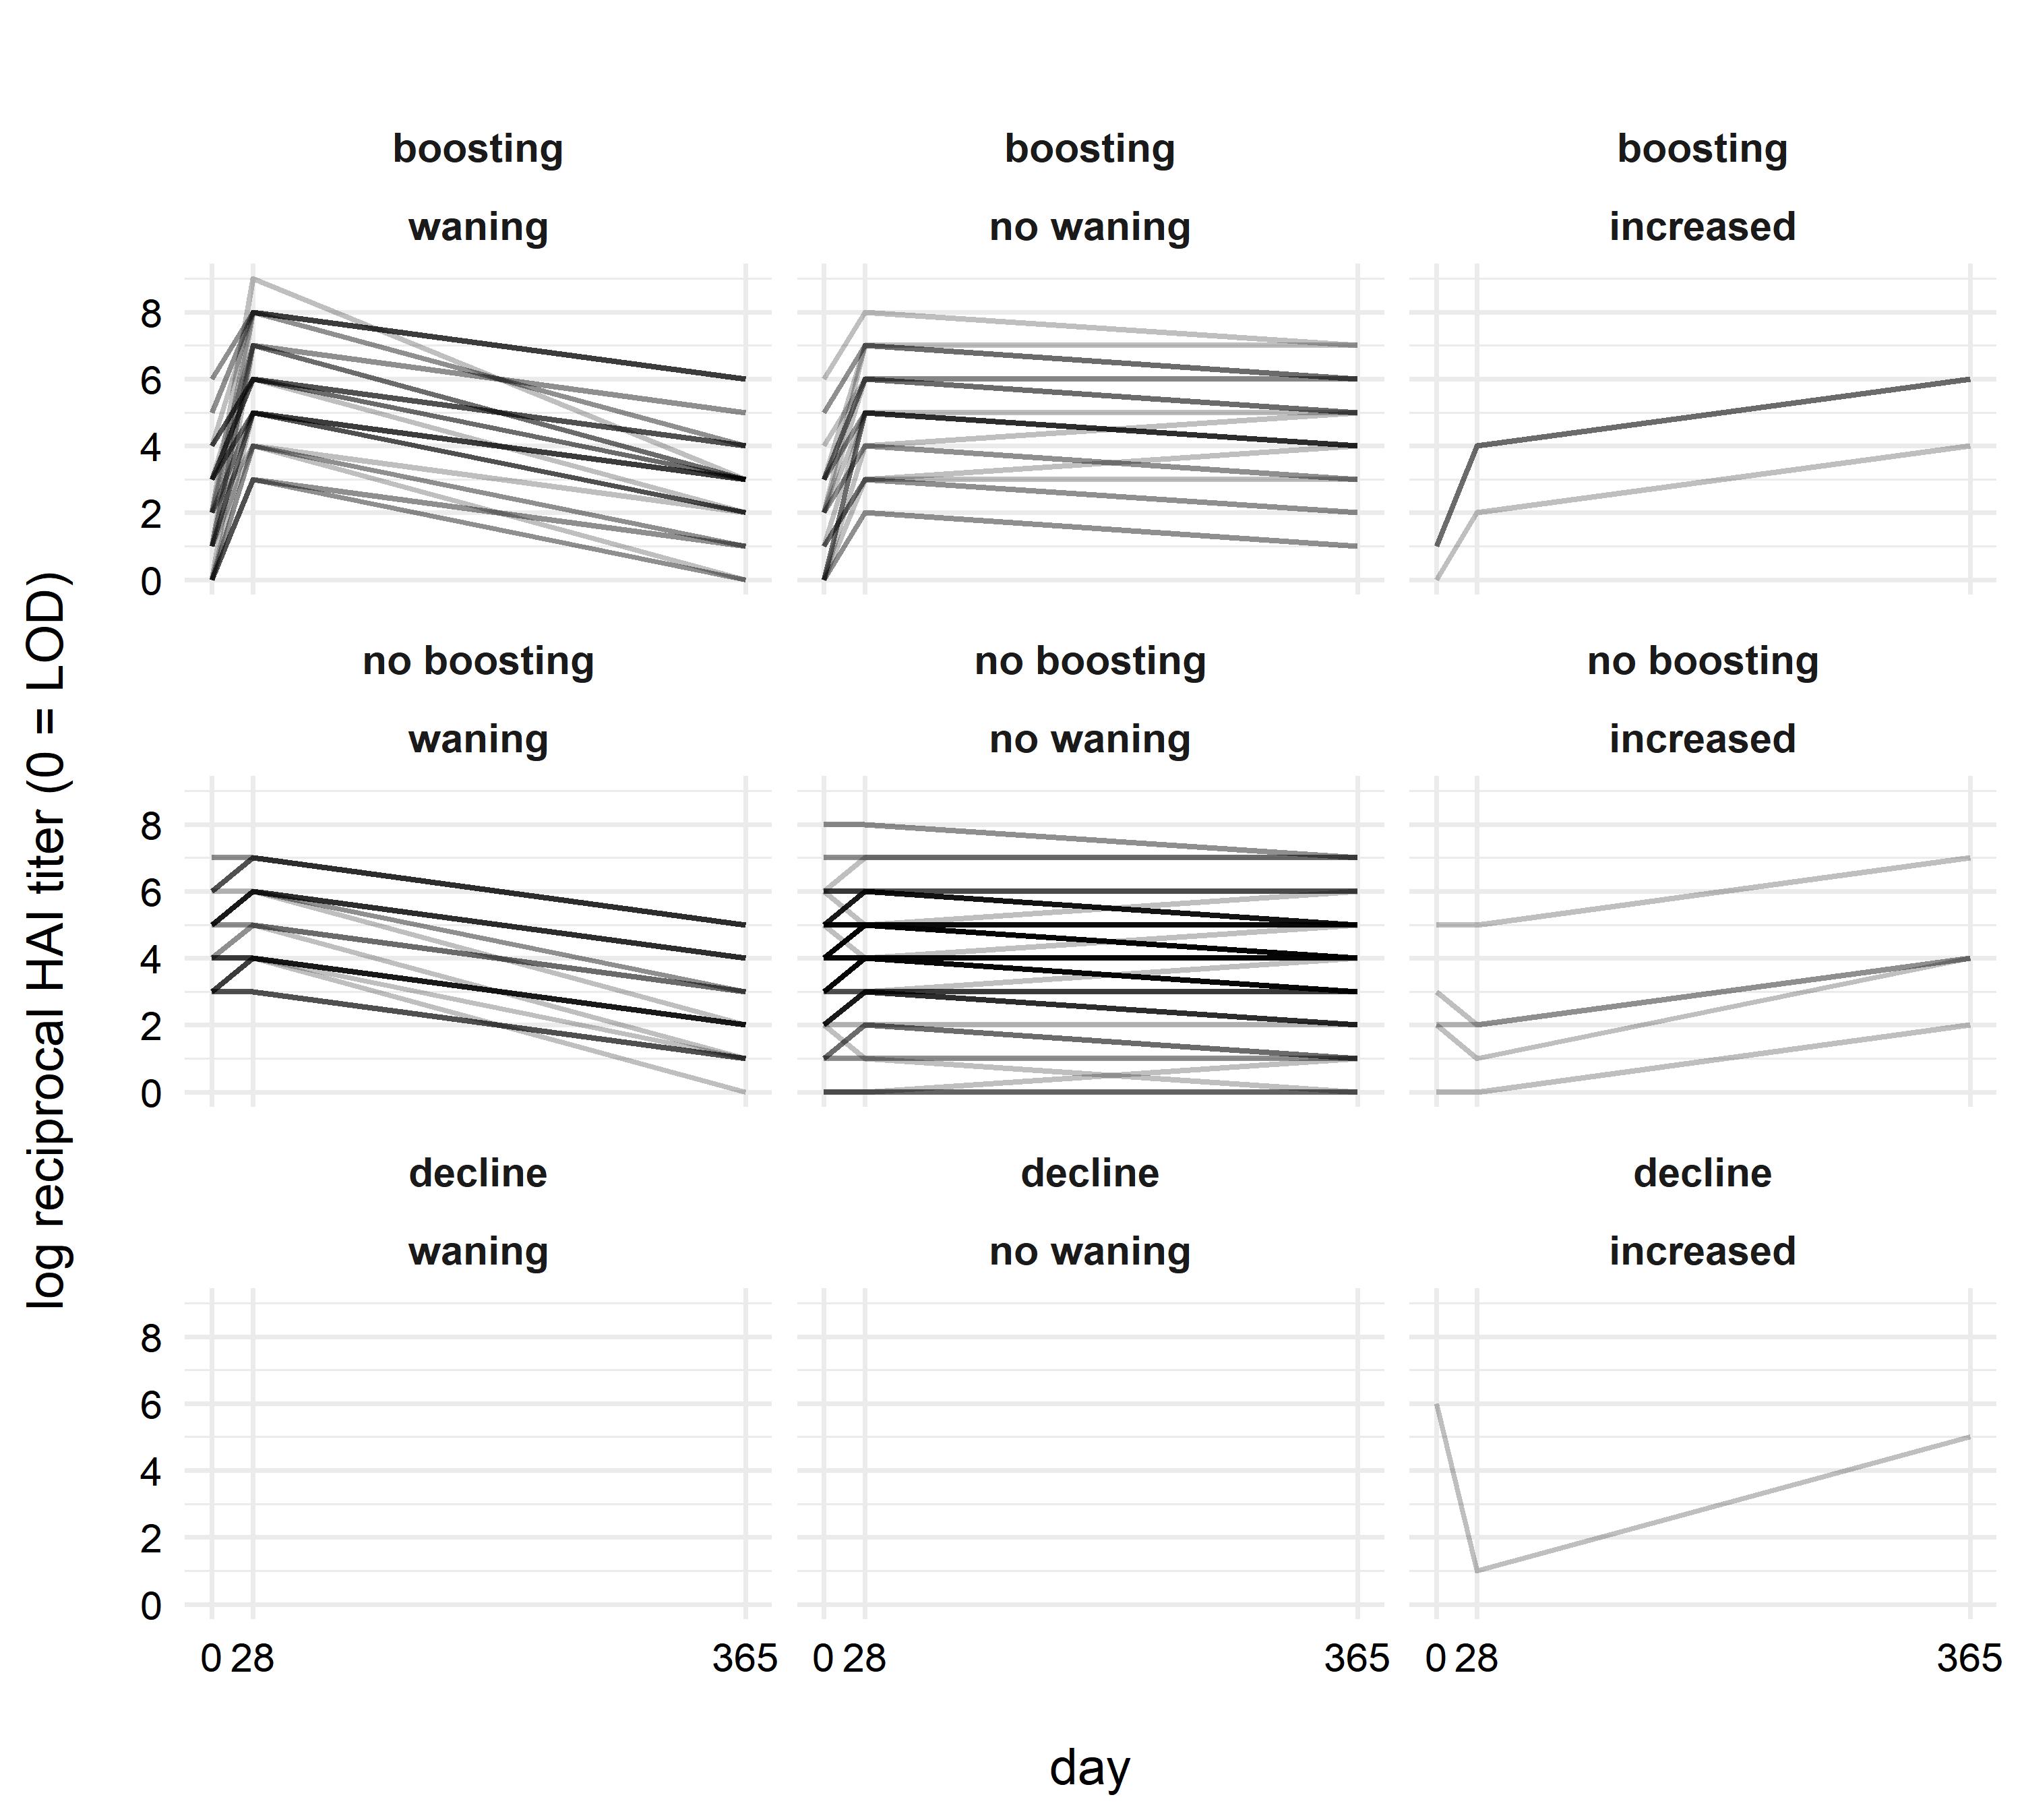
Instead of focusing on math and formal statistical analyses, my goal was to describe a conceptual framework (that I believe is novel) for analyzing longitudinal data. Often analyzing an individual’s entire trajectory over several years can be difficult to interpret, but by breaking trajectories down into 3 data points (day 0, day 21/28, and day 365 relative to the yearly vaccination), we can easily examine patterns of boosting and waning.
In the future, we intend to use this framework to quantify differences across strata, such as age groups. We also plan to include formal statistical analyses which can account for within-individual correlations.
The slides can be found here. They are also embedded below.